Straighten
The Straighten view corrects curved spectral lines in a real detector image — a common effect in wide-field spectrographs where spectral lines bow across the detector.
Table of contents
- TOC
Workflow summary
- Ensure your instrument layout has at least one mosaic window defined (see Slits & Windows).
- Switch to the Straighten view.
- Load a calibration image.
- Select a detector window.
- Inspect and export the straightening map.
Left panel — Windows
Available windows
One button appears per mosaic window defined in the current layout. Click a button to display the straightened image for that window in the central plot.
Colormap
Choose the colormap used to display pixel intensities in the straightened output.
Archive controls
| Button | Action |
|---|---|
| Export Straightener | Save the current straightening curve map as a .bin file |
| Load Straightener | Load a previously exported .bin map |
Exporting the map allows you to apply the same straightening to many images without repeating the calibration each time.
Right panel — Image
Upload
Click Upload (or drag a PNG/JPEG onto the preview canvas) to load an image. The canvas shows a thumbnail scaled to fit within 400 × 280 px while preserving aspect ratio.
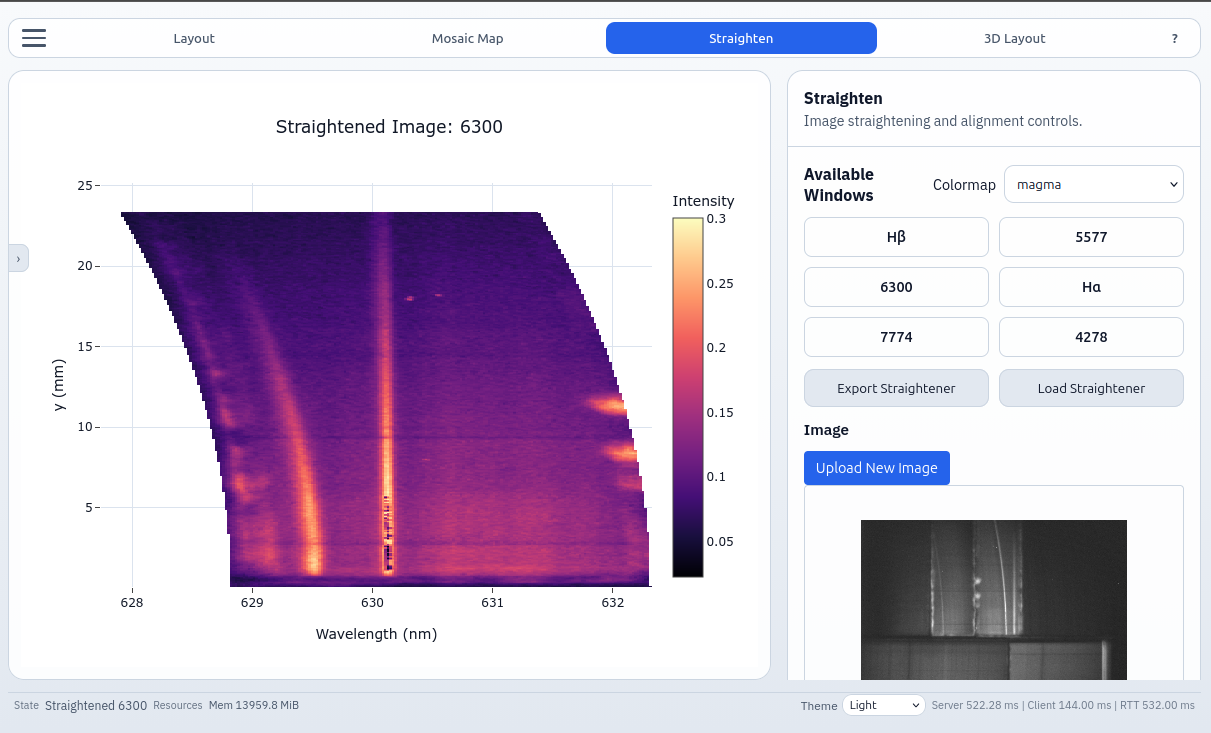
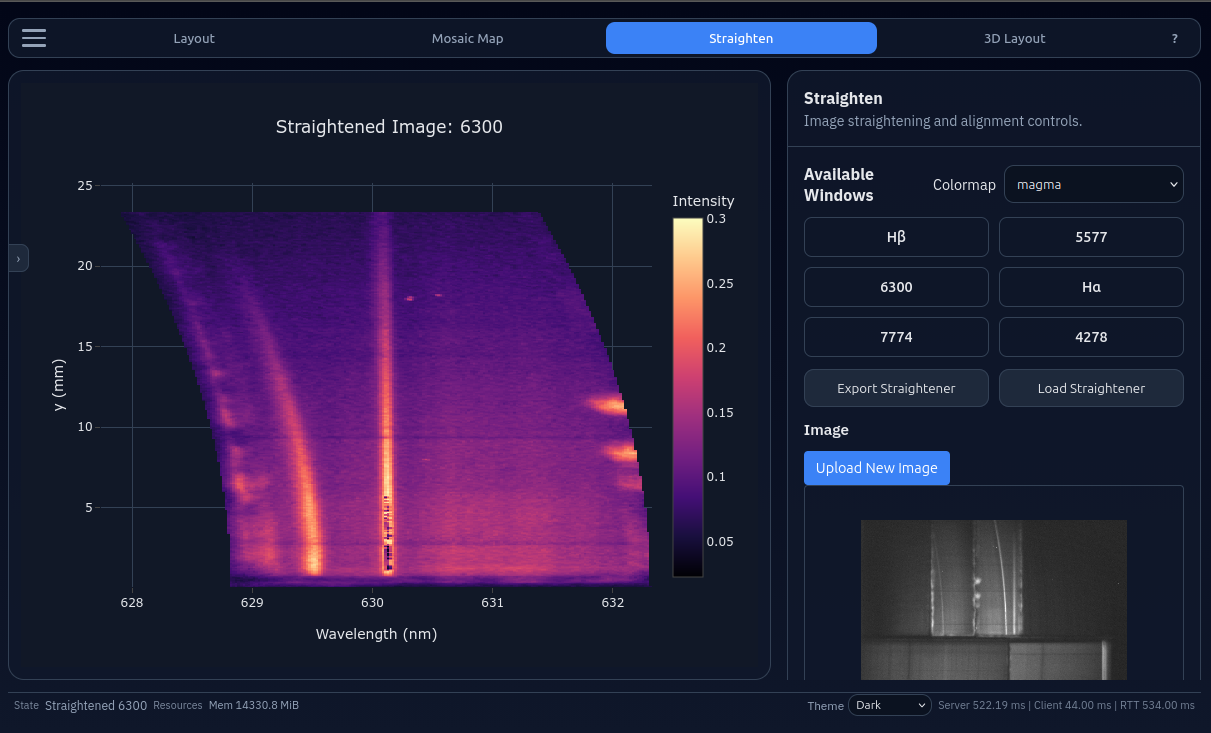
Central plot
The main area shows the straightened image for the selected window as a 2-D heatmap:
- X-axis — Wavelength (nm), derived from the optical model.
- Y-axis — Spatial position along the focal plane (mm).
- Color — Raw pixel intensity.
Hover for per-pixel wavelength, position, and intensity values.
Drag-n-Drop Support
The straighten view supports drag-n-drop for loading calibration images. Try dragging a PNG/JPEG from your computer onto the image preview panel to load it!
Troubleshooting
Missing Mosaic Window
If a mosaic window is missing from the right panel, it indicates a complete order-overlap in the current layout. Make adjustments in the Layout view (e.g. adjust bandpasses) to resolve the overlap.
Banding Artifacts
If a straightened image has banding artifacts, it indicates Y-axis splitting in the current layout. Meaning, multiple slits/orders are contributing different wavelengths to the same Y coordinates, and potentially indicates a layout design issue. Adjust the layout (e.g. adjust slit positions, mosaic window positions, grating γ (gamma) offset) to resolve the splitting.
The wavelength axis is computed from the current instrument parameters. If the layout has not been rendered since the last parameter change, re-render in the Layout view first to ensure the calibration is up-to-date.