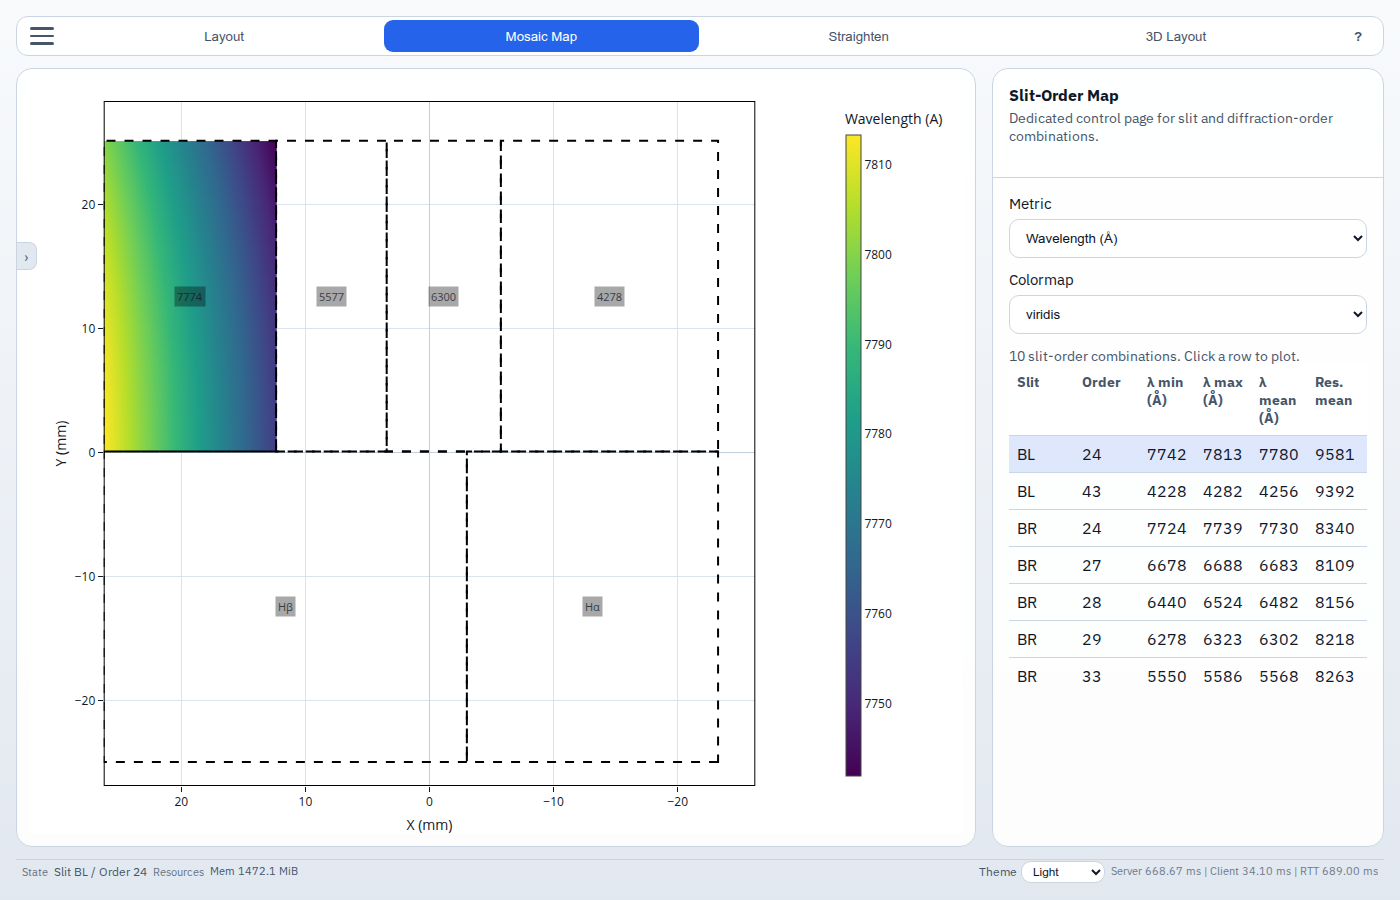
Mosaic Map
The Mosaic Map view presents a summary table of every slit × diffraction-order combination and lets you inspect each one individually.
Table of contents
Overview
Switch to this view by clicking Mosaic Map in the view ribbon. The right-hand sidebar is replaced by a dedicated control panel; the central plot shows the selected slit–order pair.
Controls
Compute
Click Compute to calculate all valid slit × order combinations for the current instrument configuration. This must be run at least once before the table appears.
Re-run Compute after changing any instrument parameter to refresh the table.
Metric
Choose what quantity to color-code the table:
| Metric | Unit |
|---|---|
| Wavelength | Å |
| Resolution | dimensionless (λ/Δλ) |
Colormap
Select the Plotly colormap used to render the per-combination plot in the central panel.
Slit–order table
Each row in the table corresponds to one slit in one diffraction order.
| Column | Description |
|---|---|
| Slit | Name of the slit |
| Order | Diffraction order integer |
| λ min | Minimum wavelength on the detector (Å) |
| λ max | Maximum wavelength on the detector (Å) |
| λ mean | Mean wavelength (Å) |
| Resolution | Mean spectral resolving power |
| Valid pixels | Number of lit detector pixels |
Click any row to select it. The selected row is highlighted and its 2-D spectral map is rendered in the central plot.