Input Spectra
The Spectra editor defines the spectral energy distribution that is projected through the instrument when Spectra mode is enabled in the Layout view. You can mix built-in day and night spectra, add custom spectra files, restrict each source to wavelength sub-ranges, and inspect the combined result.
Table of contents
- Opening the Editor
- Default Spectra Rows
- Adding Spectra
- Supported File Formats
- Table Columns
- Wavelength Range Syntax
- Combined Spectra Plot
- Tips
- References
Opening the Editor
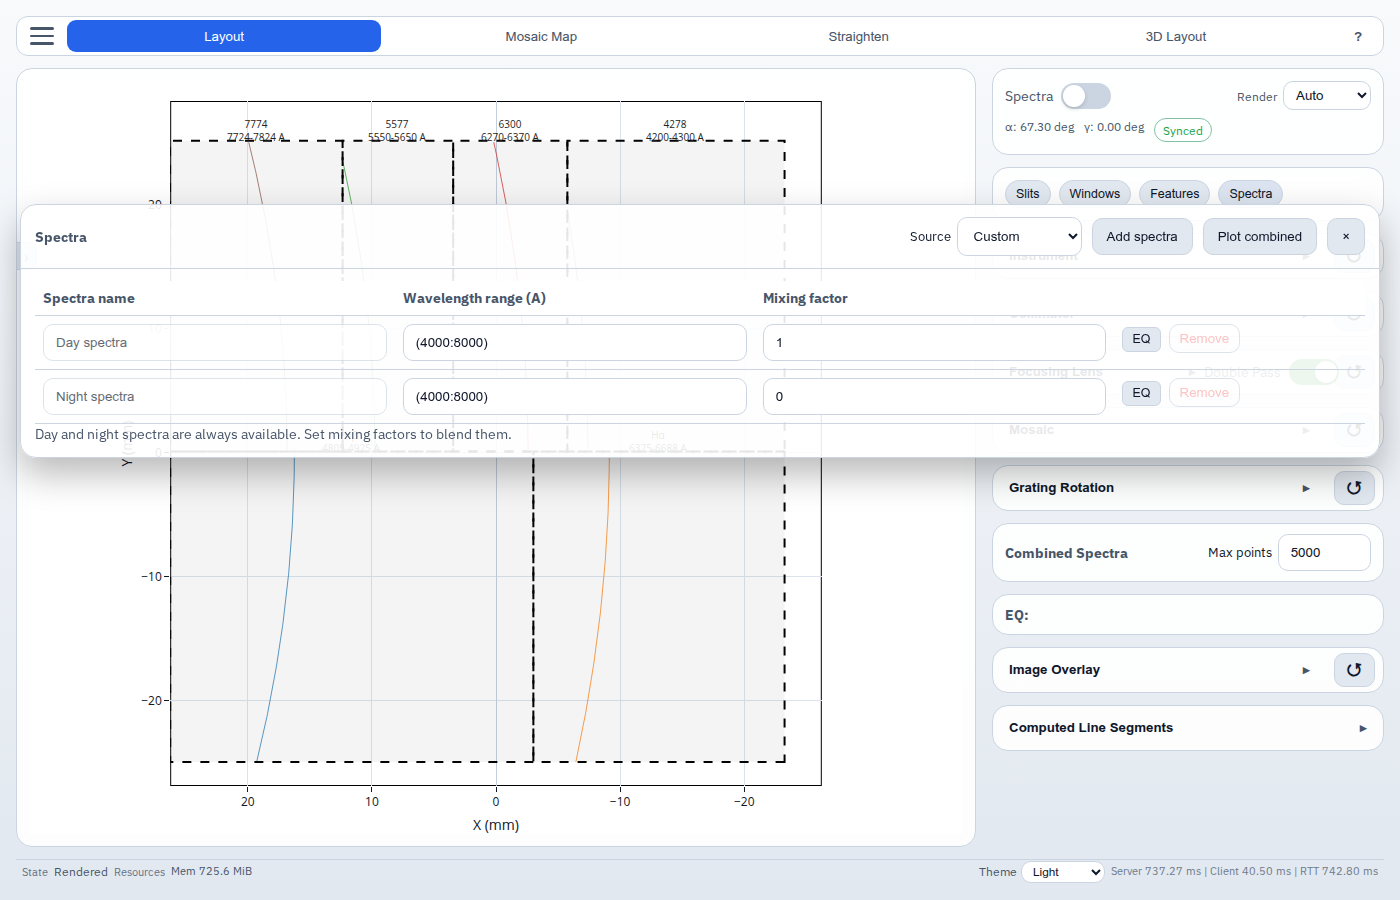
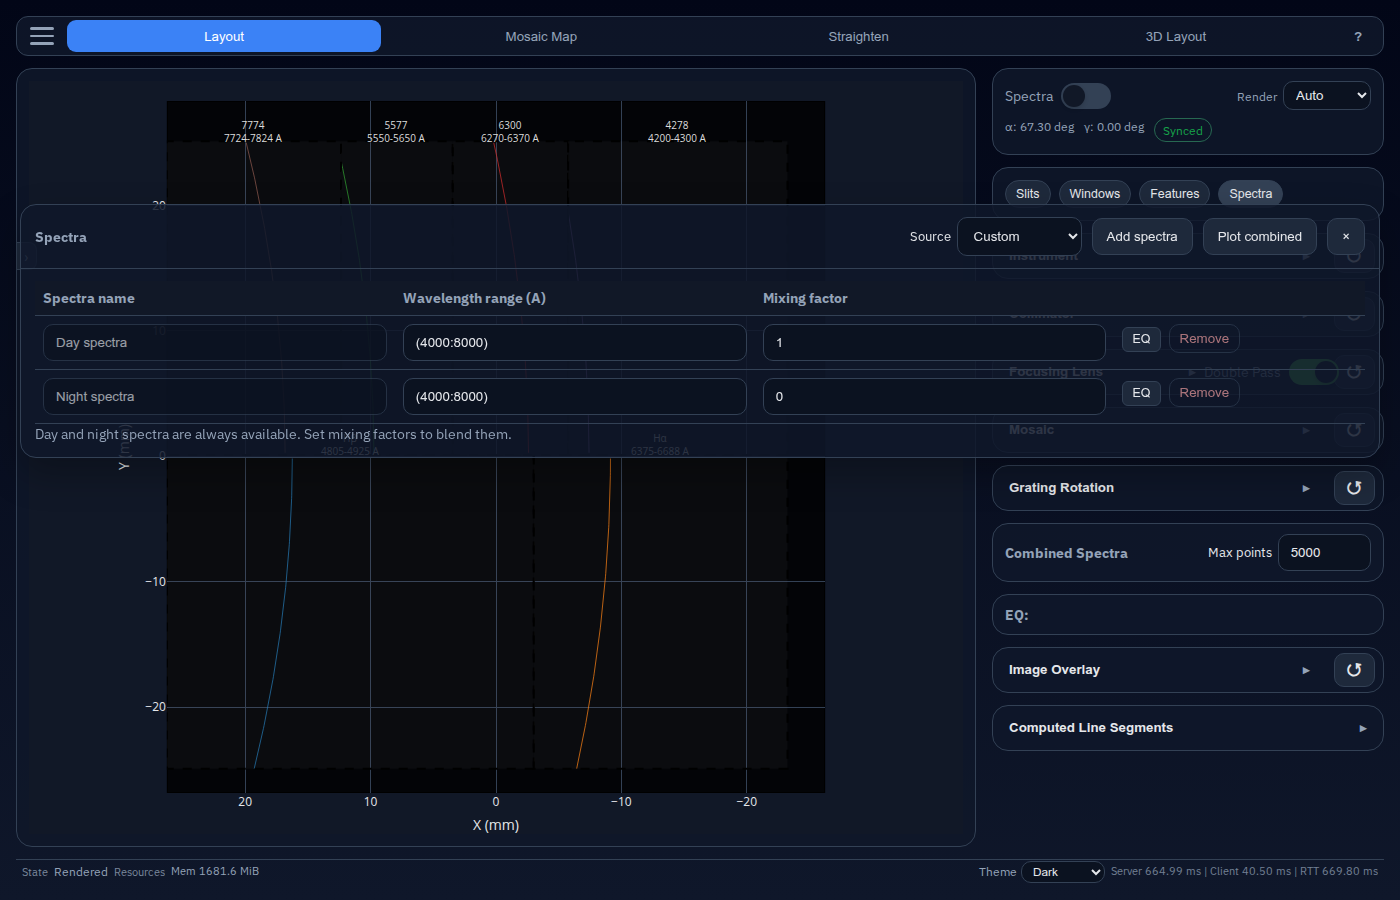
Click the Spectra chip below the mode summary card in the Layout view. The editor opens as a draggable floating window.
Default Spectra Rows
Every session starts with two built-in rows:
| Row | Default range | Default mixing factor |
|---|---|---|
| Day spectra | (4000:8000) Å | 1.0 |
| Night spectra | (4000:8000) Å | 0.0 |
These built-in rows cannot be removed. They provide a quick way to switch between daylight and night-sky simulations, or blend the two.
The built-in Day spectra reference is based on the solar irradiance compilation by Chance and Kurucz (2010). The built-in Night spectra reference is derived from the ESO UVES sky background spectrum resource.
Adding Spectra
Use the Source selector in the editor header, then click Add spectra.
| Source | Result |
|---|---|
| Day spectra | Adds another built-in daytime spectrum row |
| Night spectra | Adds another built-in night-sky spectrum row |
| Custom | Opens a file picker to upload a spectra file |
Custom uploads are stored in the active browser session and can be removed from the table.
Supported File Formats
Custom spectra files can be uploaded as:
- CSV or TXT
- NetCDF (
.nc)
CSV / TXT format
Text-based spectra files should contain at least two valid rows with:
<wavelength_nm> <flux_W_m^-2_nm^-1>
Notes:
- Values may be separated by spaces or commas.
- Blank lines and lines starting with
#are ignored. - Non-numeric header lines are tolerated before the first numeric row.
- Wavelengths are sorted automatically, but must be strictly increasing after sorting.
NetCDF format
NetCDF uploads must contain:
- a 1-D wavelength coordinate or variable, commonly named
wavelength,lambda, orwl - a 1-D irradiance-like data variable, commonly named
irradiance,intensity,flux, orvalue
If units are present, they are converted to:
- wavelength in nm
- irradiance in W m-2 nm-1
Table Columns
| Column | Description |
|---|---|
| Spectra name | Label for the source row (read-only for default rows) |
| Wavelength range (Å) | One or more active wavelength windows in Å |
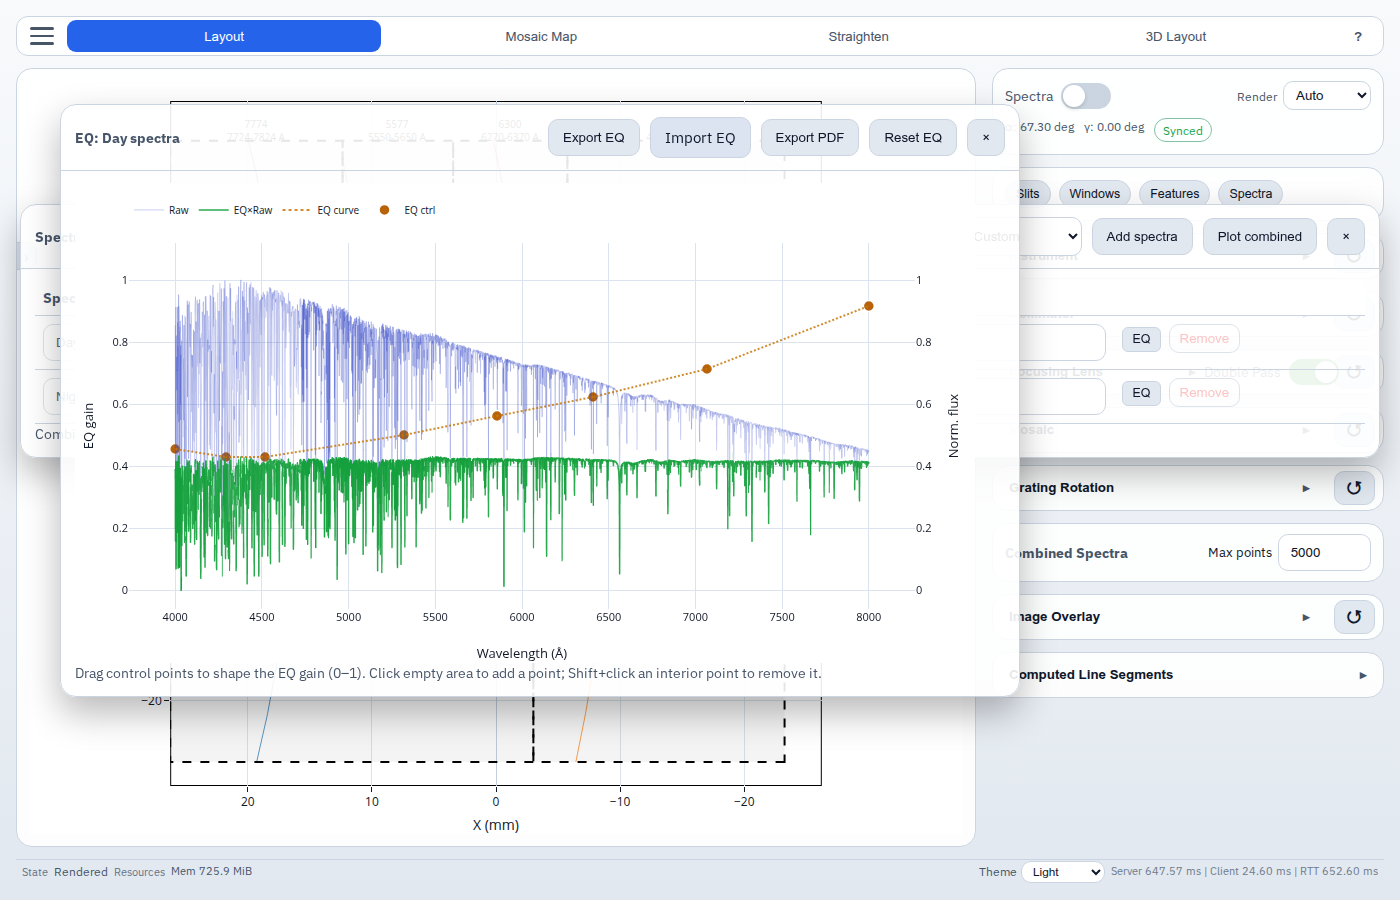
| Mixing factor | Scalar multiplier applied before the EQ’ed row is added to the combined spectrum |
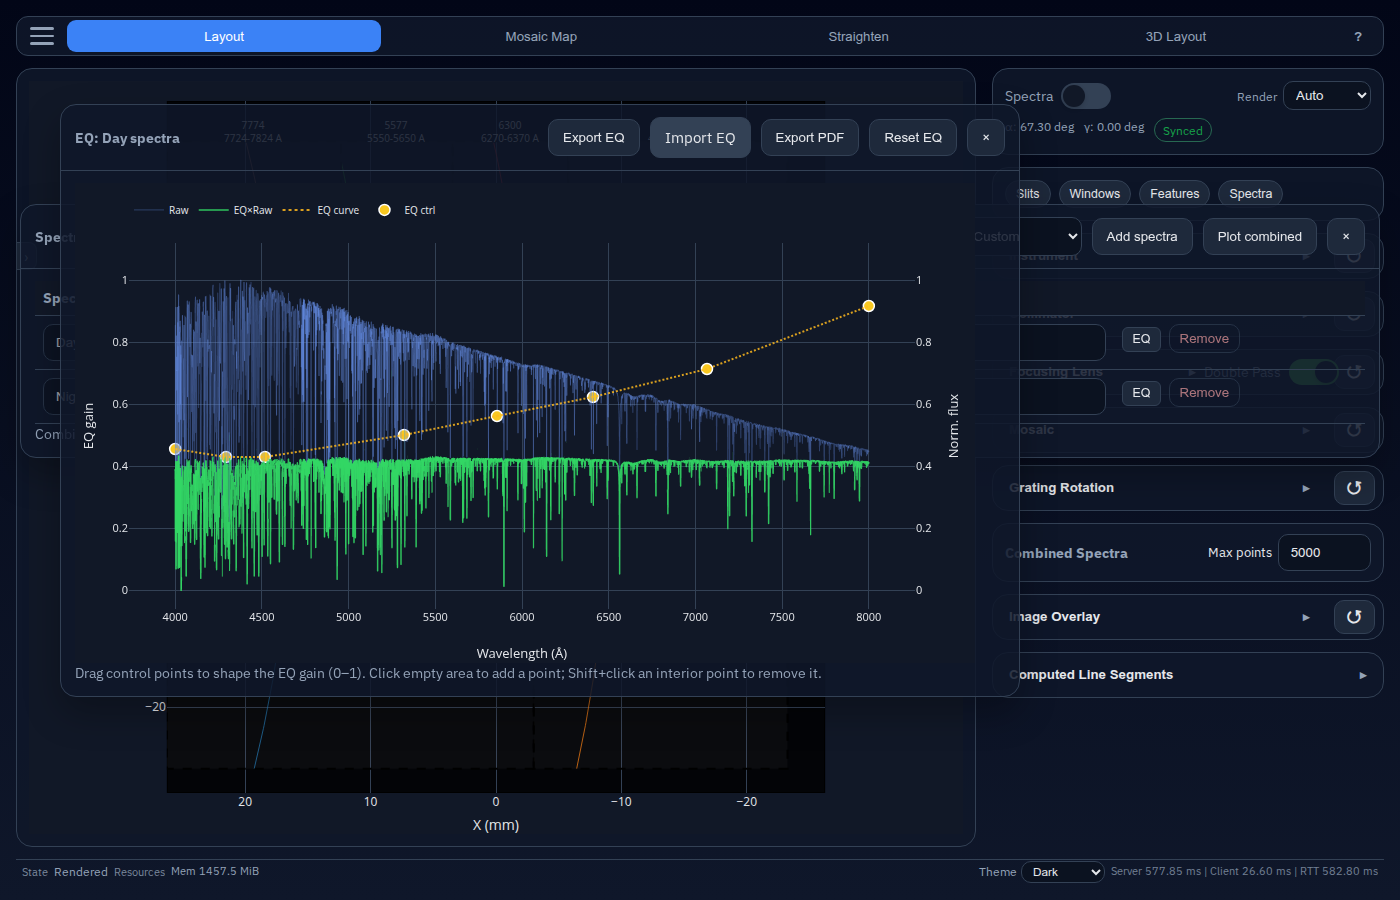
| EQ | Variable gain (0–1) over the selected wavelength range |
Rows with a mixing factor of 0 contribute nothing to the final combined spectrum.
The mixing is performed following the equation
\[I_\text{eff}(\lambda) = \sum_n s_n \, G_n(\lambda) \, I_n(\lambda),\]where $I_n(\lambda)$ is the $n$th irradiance spectra, $G_n(\lambda) \in [0, 1]$ is the wavelength-dependent gain factor, and $s_n$ is the scalar combination factor.
Wavelength Range Syntax
The Wavelength range (Å) field accepts one or more comma-separated ranges in angstrom:
4000:5000
(4000:5000)
(4000:5000), (6500:6600)
Rules:
- Each range uses
low:high. - Parentheses are optional, except when multiple ranges are chained.
- If
low > high, the values are swapped automatically. - If the field is left blank, the full wavelength span of that source is used.
Only the selected ranges are interpolated into the common combined spectra grid.
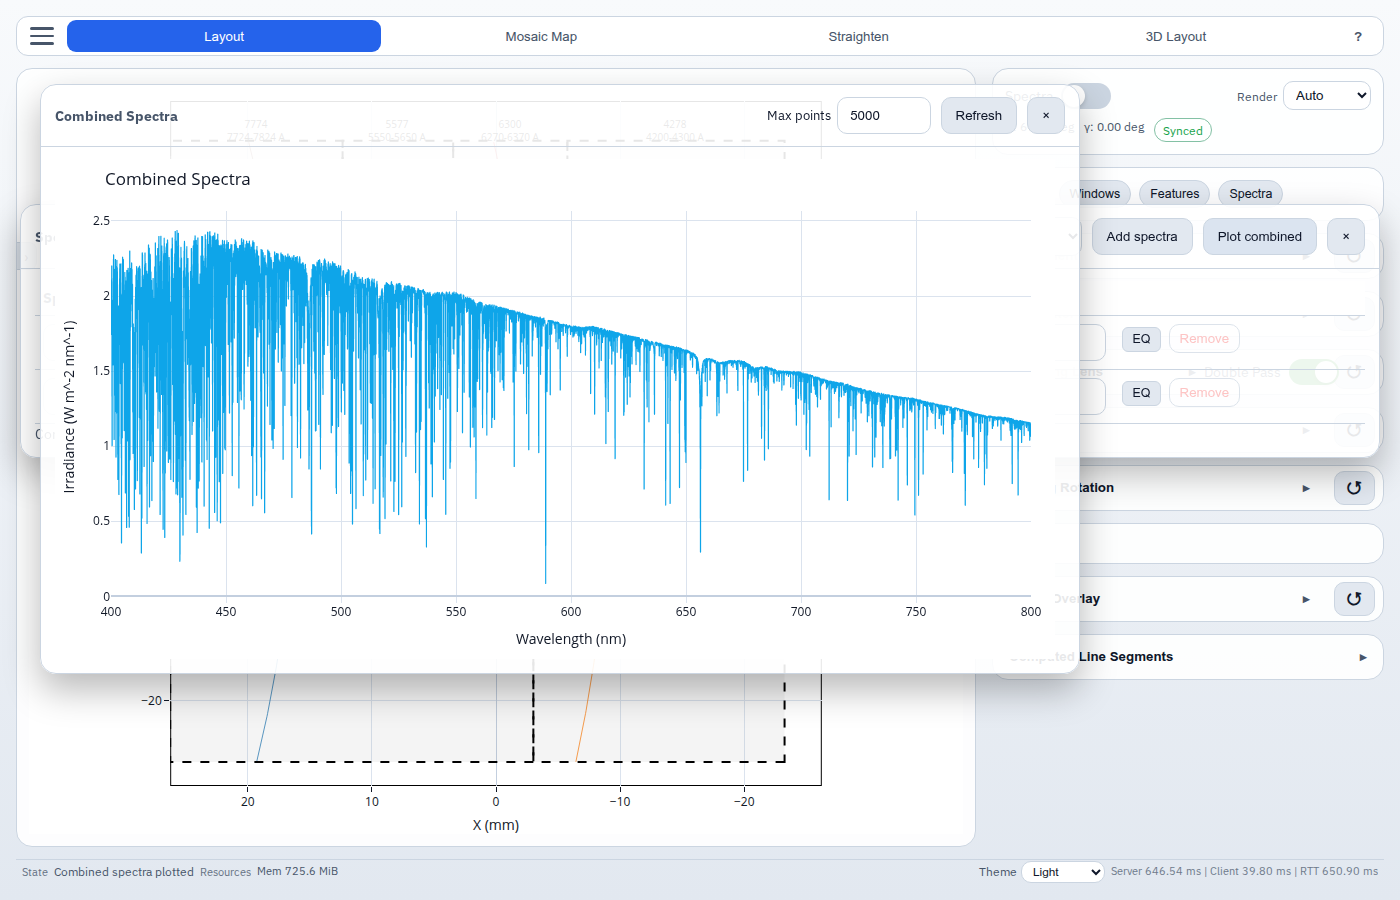
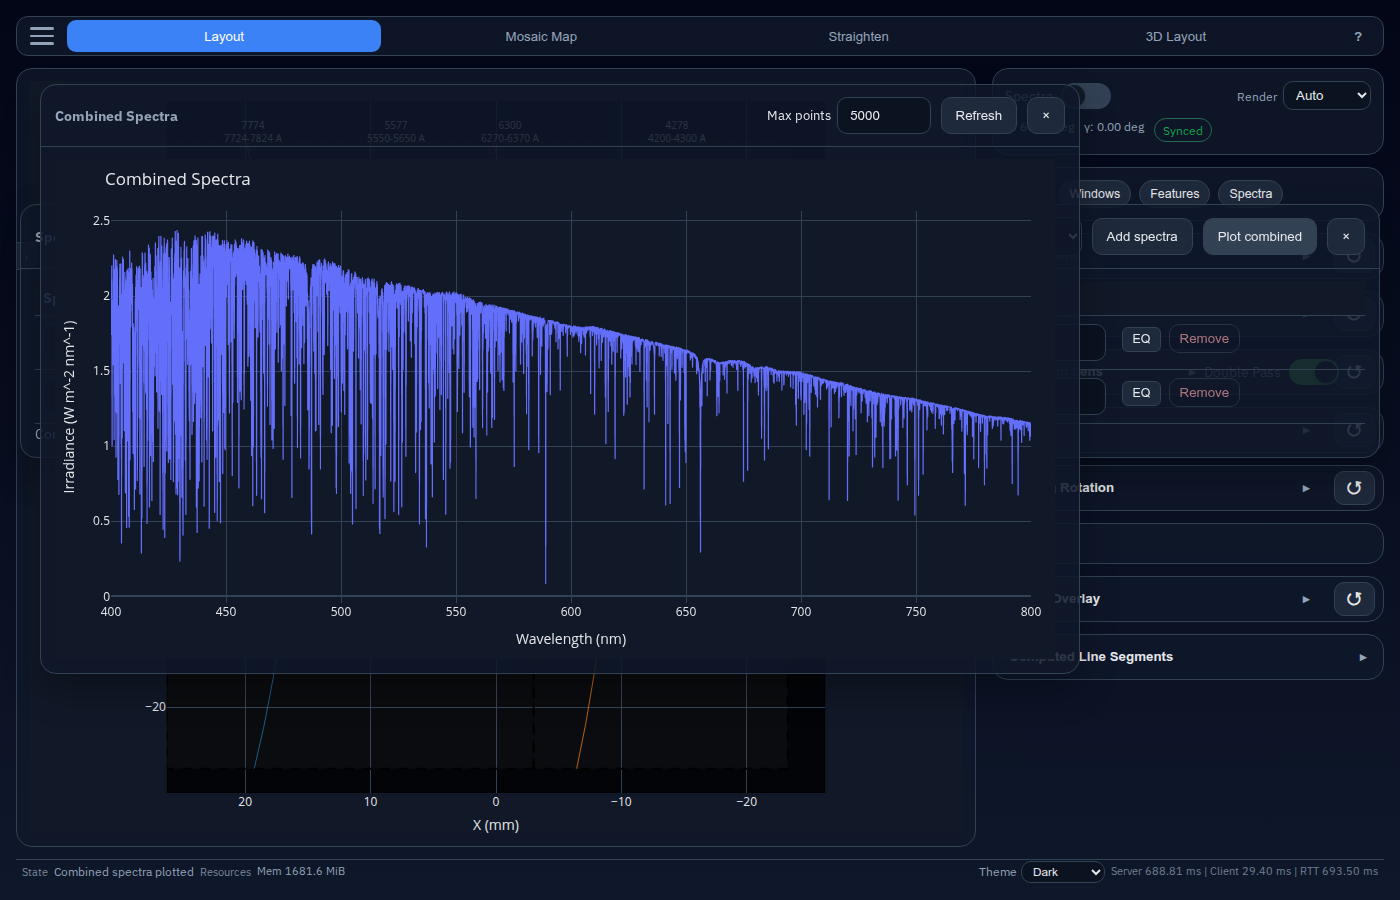
Combined Spectra Plot
Click Plot combined in the Spectra editor to open a second pop-out window that shows the current mixed spectrum.
This plot:
- combines all active rows using their wavelength ranges and mixing factors
- resamples them onto a common wavelength grid
- supports zooming and panning
- can be refreshed manually with Refresh
- limits rendering density with the Max points control
The plot follows the current light or dark UI theme.
Tips
Use a mixing factor of 1 for the dominant source and fractional values such as 0.1 or 0.25 for weaker additive components.
Create multiple rows from the same built-in source with different wavelength ranges if you want to weight different spectral regions independently.
Keep custom spectra files in nanometers and W m^-2 nm^-1 to avoid ambiguity when validating input data.
References
- Chance, K., and Kurucz, R. L. (2010). An improved high-resolution solar reference spectrum for Earth’s atmosphere measurements in the ultraviolet, visible, and near infrared. Journal of Quantitative Spectroscopy and Radiative Transfer, 111(9), 1289-1295. DOI: 10.1016/j.jqsrt.2010.01.036
- European Southern Observatory (ESO). UVES Pipeline Sky Spectrum. Retrieved from https://www.eso.org/observing/dfo/quality/UVES/pipeline/sky_spectrum.html